Generate a pcap file
The first thing to do before starting this tutorial is to generate a pcap file:
cedric@debian:~$ mkdir captures data
root@debian:~$ tcpdump -p -i eth0 -s 0 -w captures/capture.pcap
Of course, you can also use a pcap file found on Internet.
GraphViz
# create an object from the capture
cedric@debian:~/IP-Link/ip-link$ ./pcap_to_object.py -i ~/captures/capture.pcap -o ~/data/dic.pyobj
Reading pcap file...
Serialization...

# create the GraphViz graph
cedric@debian:~/IP-Link/ip-link$ ./object_to_graphviz.py -i ~/data/dic.pyobj
Loading dictionary...
Creating GraphViz DOT file...
Writting file.
The first command create a pcap. tcpdump captures all the network traffic on all interfaces and create captures/capture.pcap. The second one parse the pcap and generate a serialized graph. The last command create the DOT file from the saved serialized graph.
Now you can see the result by typing:
dotty ~/data/ip.dot
or :
dot -Tpng -o graphviz.png ~/data/ip.dot
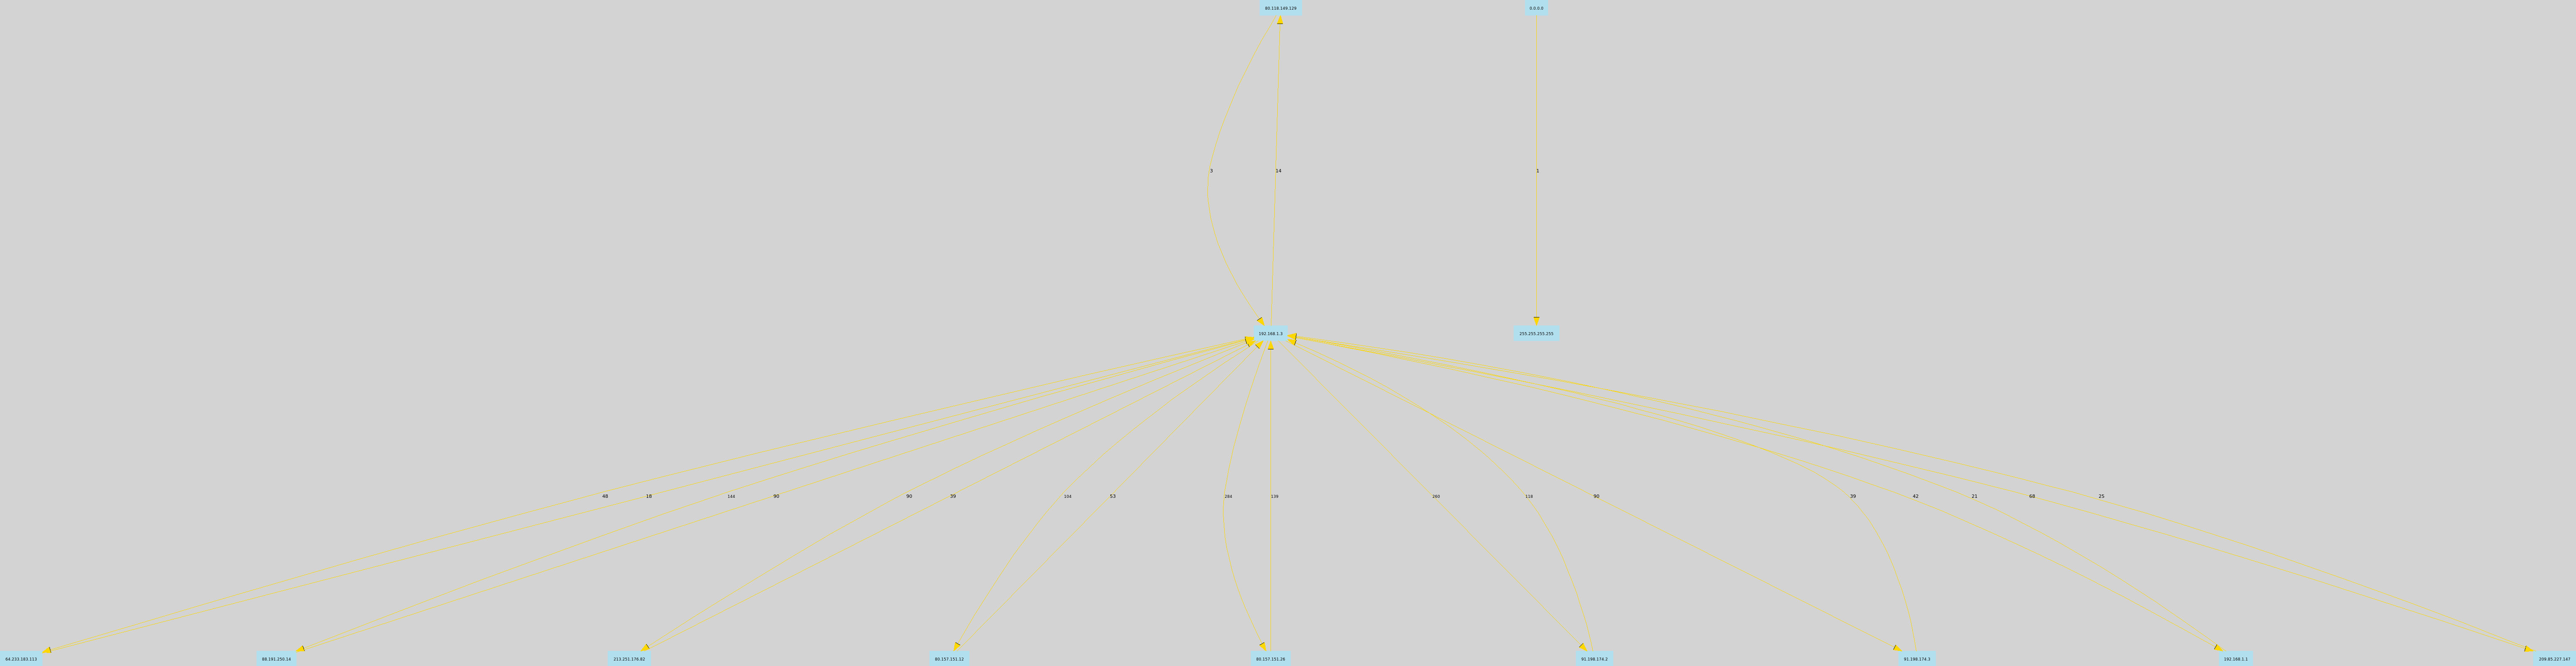
Result
Chord diagram with Circos
Circos installation
First, download the latest version of CIRCOS and the Circos tools (for the table viewer). The required Perl module can be installed with:
cpan -i module_name
You can download this example of Circos configuration.
Generation of the input matrix for Circos
cedric@debian:~/ip-link/ip-link$ ./pcap_to_object.py -i ~/captures/capture.pcap -o ~/data/capture.pyObj
Reading pcap file...
Serialization...

cedric@debian:~/ip-link/ip-link$ ./object_to_circos.py -i ~/data/capture.pyObj -o ~/data/capture.circos
Loading objet...
Searching IP that are source and destination...
Circos matrix generation...
Saving the matrix...
The first command generated a graph from the network capture.
The second one create the matrix capture.circos of relation between IPs,from serialized
object capture.pyObj. Here is the generated matrix.
The matrix capture.circos will be the input for the Circos table viewer.
Generation of the chord diagram
cedric@debian:~/circos-0.67-5$ cat capture.circos | tools/tableviewer/bin/parse-table  | tools/tableviewer/bin/make-conf -dir data
cedric@debian:~/circos-0.67-5$ ./bin/circos -conf circos.conf
The first command use the tool provided with Circos, tableviewer, to create Circos data files from matrix. The second one execute Circos, with the data files generated, and create the graph.
Here is the generated chord diagram:
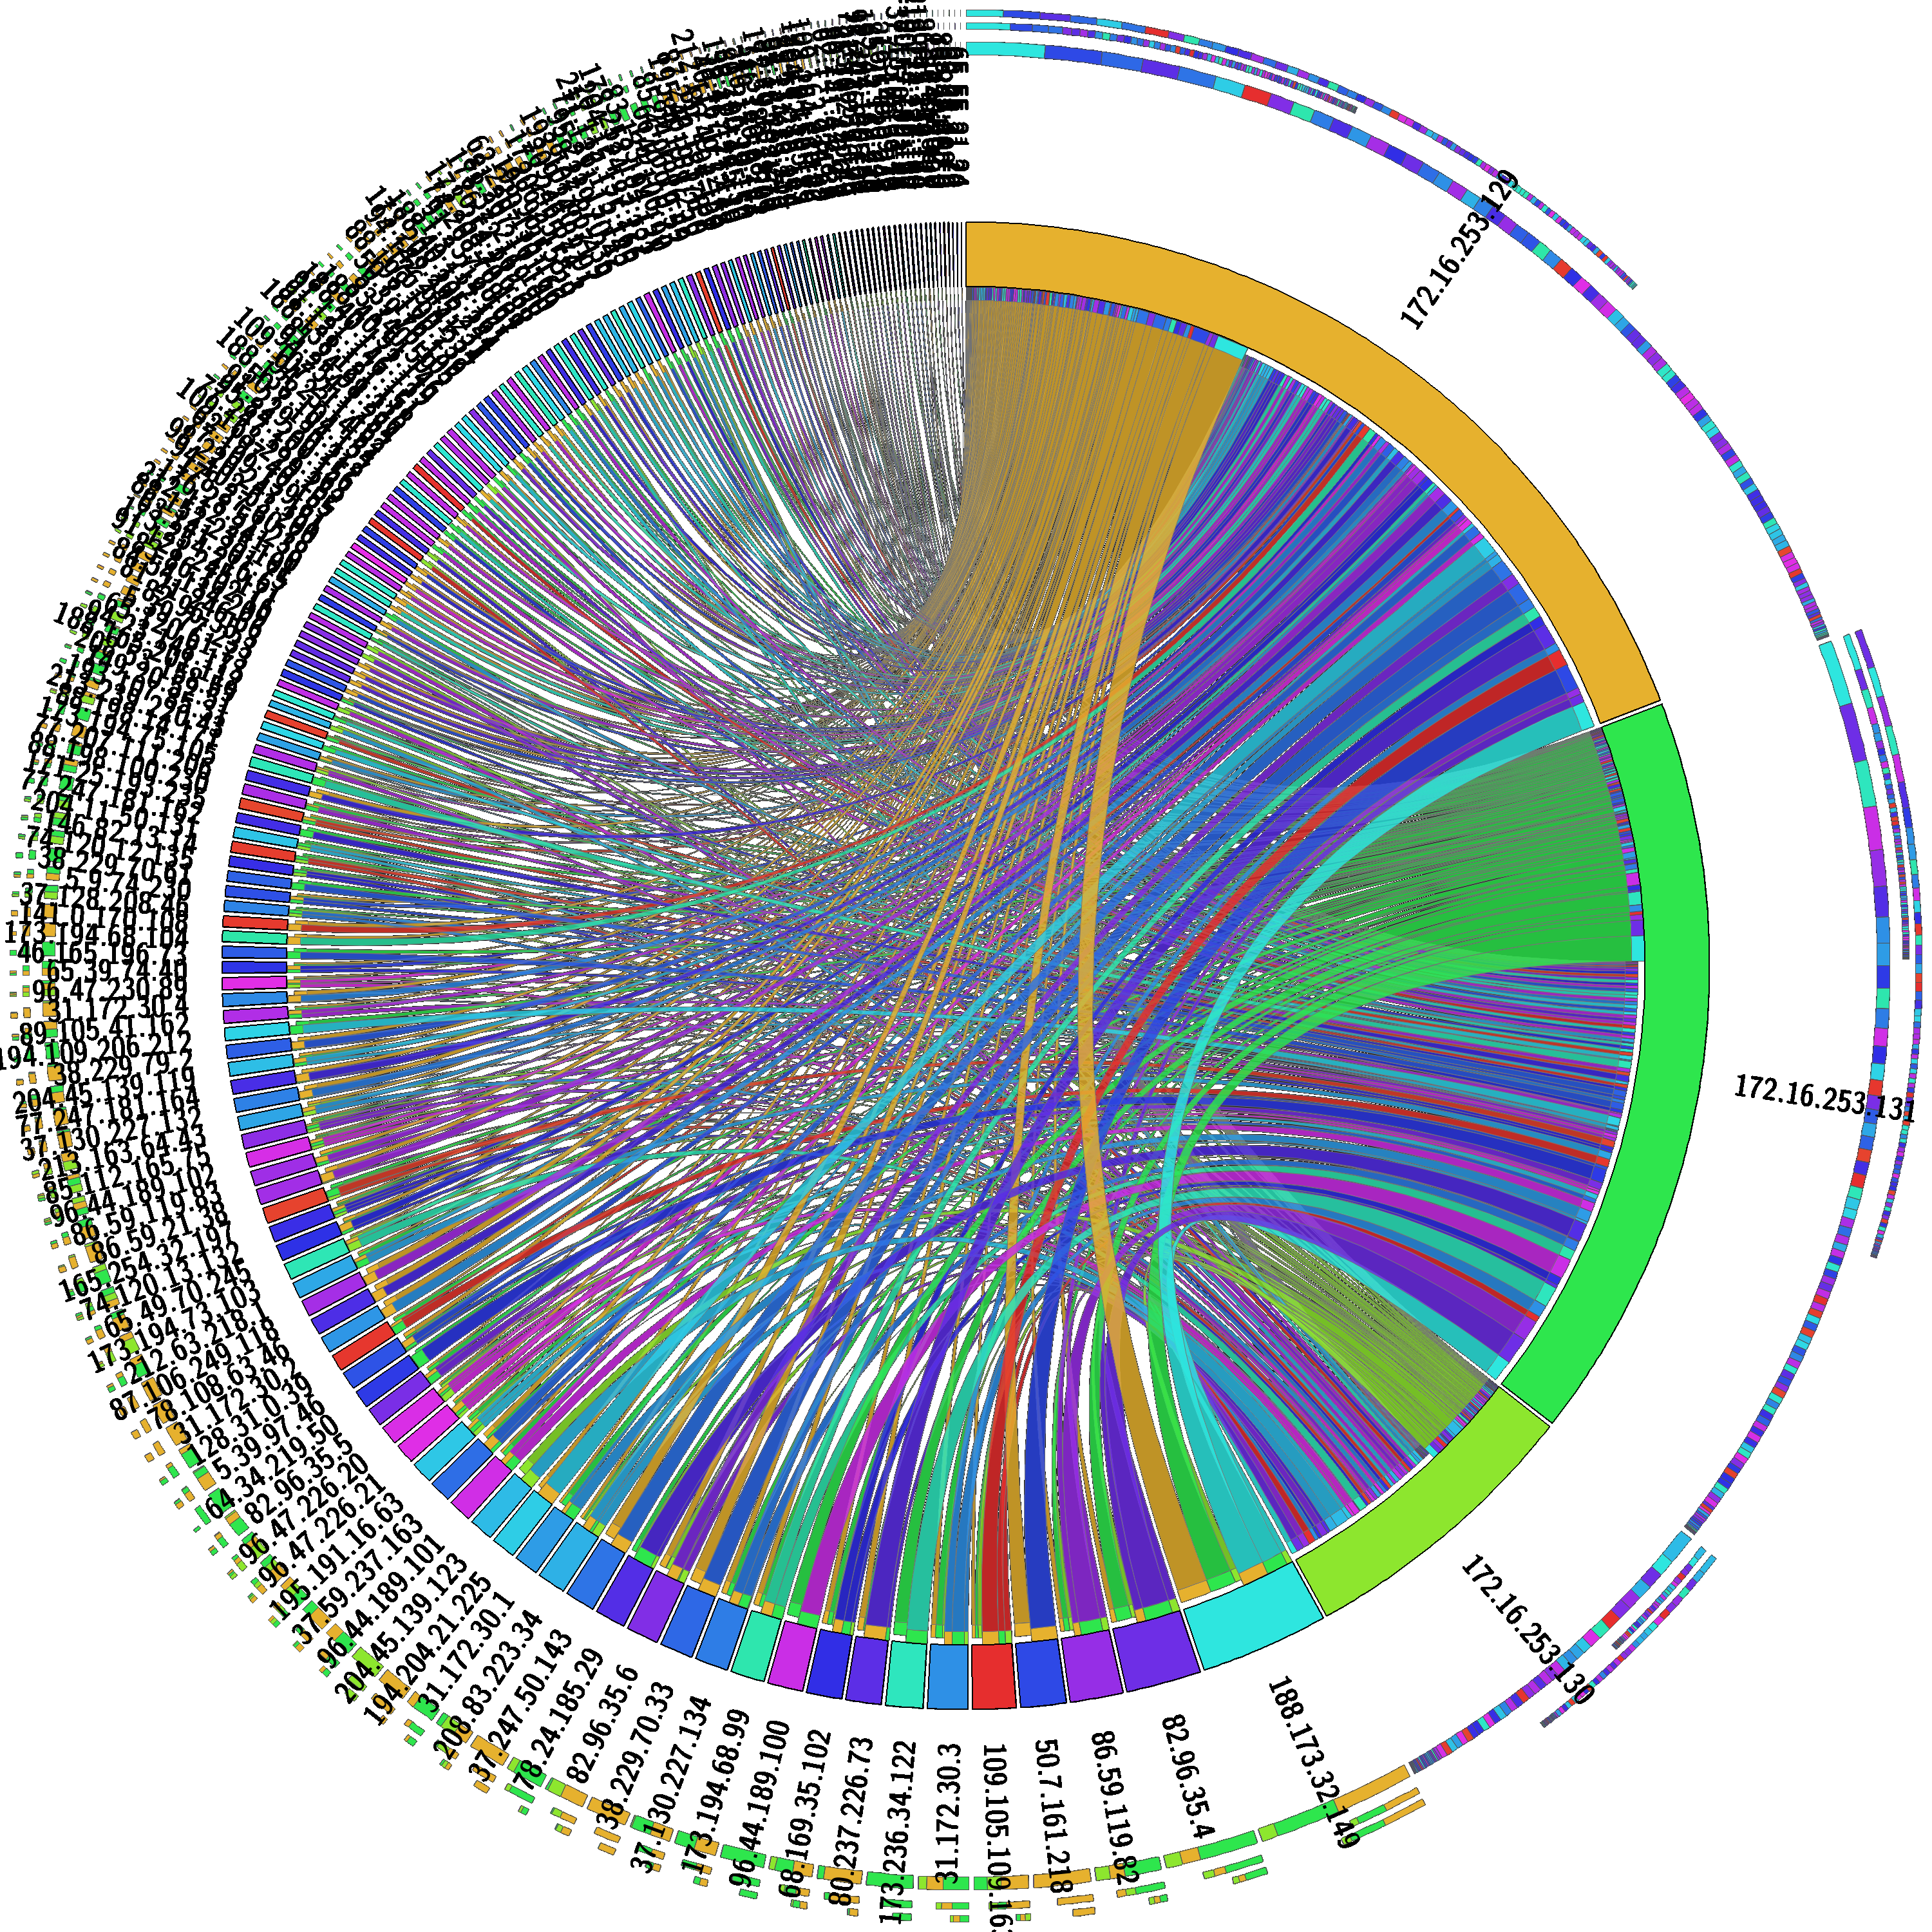
Bézier curve
More details on this page. This view enables to see the relations between ports.
Scatter plot with ploticus
cedric@debian:~/IP-Link/ip-link$ ./pcap_to_object.py -i ~/captures/capture.cap
Reading pcap file...
Serialization...

cedric@debian:~/IP-Link/ip-link$ ./sqlite_to_object.py -r tts -p 1231950347:1231950547
DB connect
Query sent to the base :
        SELECT ip_src, ip_dst FROM ip_link WHERE tts >= 1231950347 AND tts <=  1231950547
Creating object...
Reading query result...
Serialization...

cedric@debian:~/IP-Link/ip-link$ ./object_to_scatterplot.py
Loading dictionary...
Creating categories file
Creating ploticus data file
Command to execute :
        ploticus -o ./scatterplot/scatterplot.png -png ./scatterplot/scatterplot -csmap -maxproclines
Creating HTML map
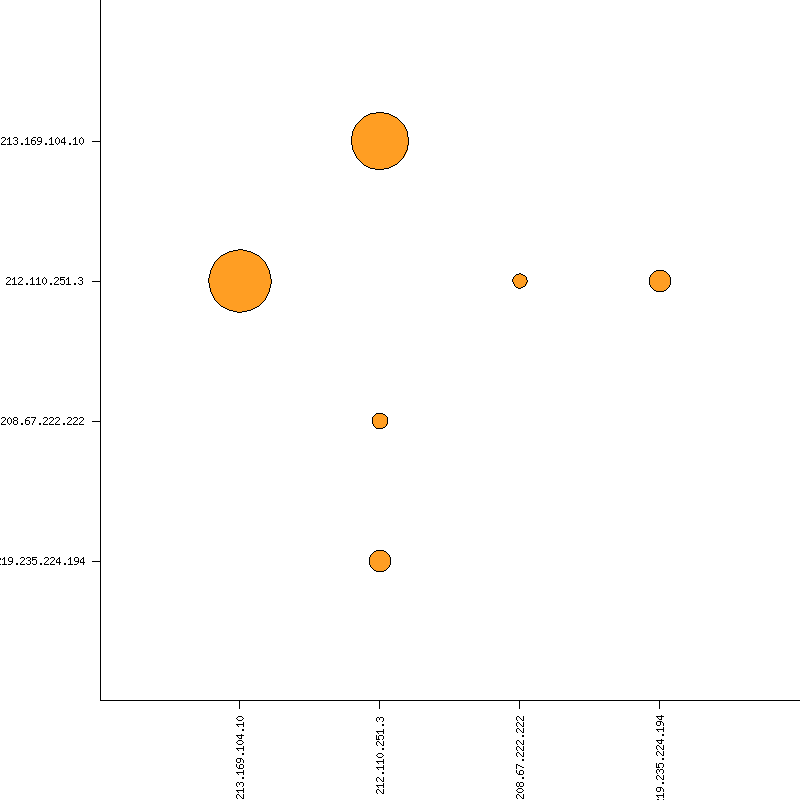
Result
Picviz
cedric@debian:~/IP-Link/ip-link$ ./pcap_to_sqlite.py -i ~/captures/capture.cap -o ~/data/ip.sql

cedric@debian:~/IP-Link/ip-link$ ./sqlite_to_picviz.py -i ~/data/ip.sql -r time -p 2009-1-16-00-03-00:2009-1-16-00-05-00
DB connect
Query sent to the base :
    SELECT tts, ip_src, ip_dst FROM ip_link WHERE tts >= 1232060580.0 AND tts <=  1232060700.0
Creating Picviz file...
Writting file...
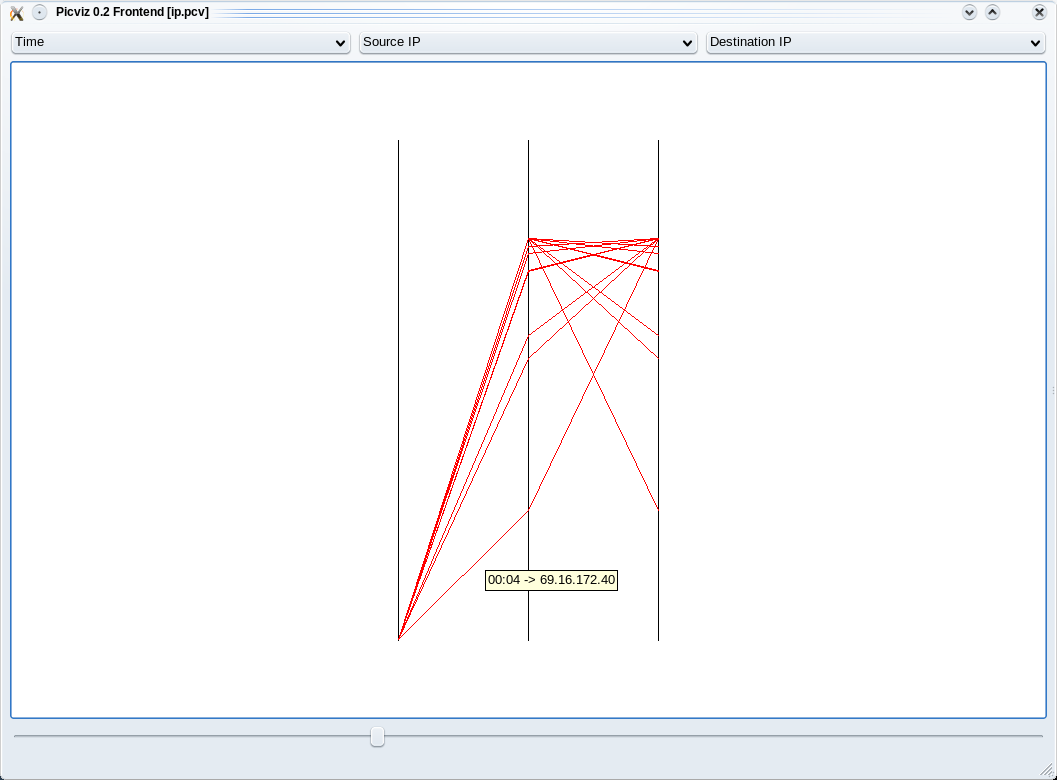
With these otions sqlite_to_picviz.py extract the traffic between 2009/01/16 00h03m00s and 2009/01/16 00h05m00s. Then it creates the Picviz file.
Result
RealTime Graph 3D
cedric@debian:~/IP-Link/ip-link$ ./pcap_to_object.py -i ~/captures/capture.pcap
Reading pcap file...
Serialization...

cedric@debian:~/IP-Link/ip-link$ ./object_to_rtgraph.py
Result
MooWheel
cedric@debian:~/IP-Link/ip-link$ ./pcap_to_sqlite.py -i ~/captures/capture.cap

cedric@debian:~/IP-Link/ip-link$ ./sqlite_to_object.py
DB connect
Query sent to the base :
        SELECT ip_src, ip_dst FROM ip_link
Creating object...
Reading query result...
Serialization...

cedric@debian:~/IP-Link/ip-link$ ./object_to_moowheel.py
Loading dictionary...
Creating MooWheel file...
Writting file.
Result
Pointing your mouse over 212.110.251.3 will let you see that 5 IP are not contacted by 212.110.251.3. If you want to see better, you can make a filter this way :
cedric@debian:~/IP-Link/ip-link$ ./sqlite_to_object.py -r ip_src -p 212.110.251.3
DB connect
Query sent to the base :
        SELECT ip_src, ip_dst FROM ip_link WHERE ip_src = "212.110.251.3"
Creating object...
Reading query result...
Serialization...

cedric@debian:~/IP-Link/ip-link$ ./object_to_moowheel.py -q
Now, 82.0.72.48, 86.0.48.47, 125.211.214.144, 123.129.255.167 and 91.121.165.159 are missing. These IP are never contacted by 212.110.251.3.
Another output with a bit more IP: http://cedric.bonhomme.free.fr/ip-link/moowheel/moowheel1.html
Histogram
cedric@debian:~/IP-Link/ip-link$ ./pcap_to_object.py -i ~/captures/capture.cap
Reading pcap file...
Serialization...

cedric@debian:~/IP-Link/ip-link$ ./object_to_csv.py
Loading dictionary...
Writting CSV file...
cedric@debian:~/IP-Link/ip-link$ ./csv_to_histogram.py -s 192.168.1.2
Result
Here, for the moment, the legend is not display because histograms are used with the HTML gallery.
Filter by date
cedric@debian:~/IP-Link/ip-link$ ./sqlite_to_object.py -i ~/data/ip.sql -r time -p 2009-1-15-22-00-00:2009-1-16-02-00-00
DB connect
Request sent to the base :
    SELECT ip_src, ip_dst FROM ip_link WHERE tts >= 1232053200.0 AND tts <=  1232067600.0
Creating object...
Reading the result of the query...
Serialization...

cedric@debian:~/IP-Link/ip-link$ ./object_to_graphviz.py -q

cedric@debian:~/IP-Link/ip-link$ dot -Tpng data/ip.dot -o pic.png
Result
The generated graph represent the traffic between 2009/01/15 22h00m00s and 2009/01/16 02h00m00s.